
Cloud Forensics in the Age of AI Agents: A Field Report
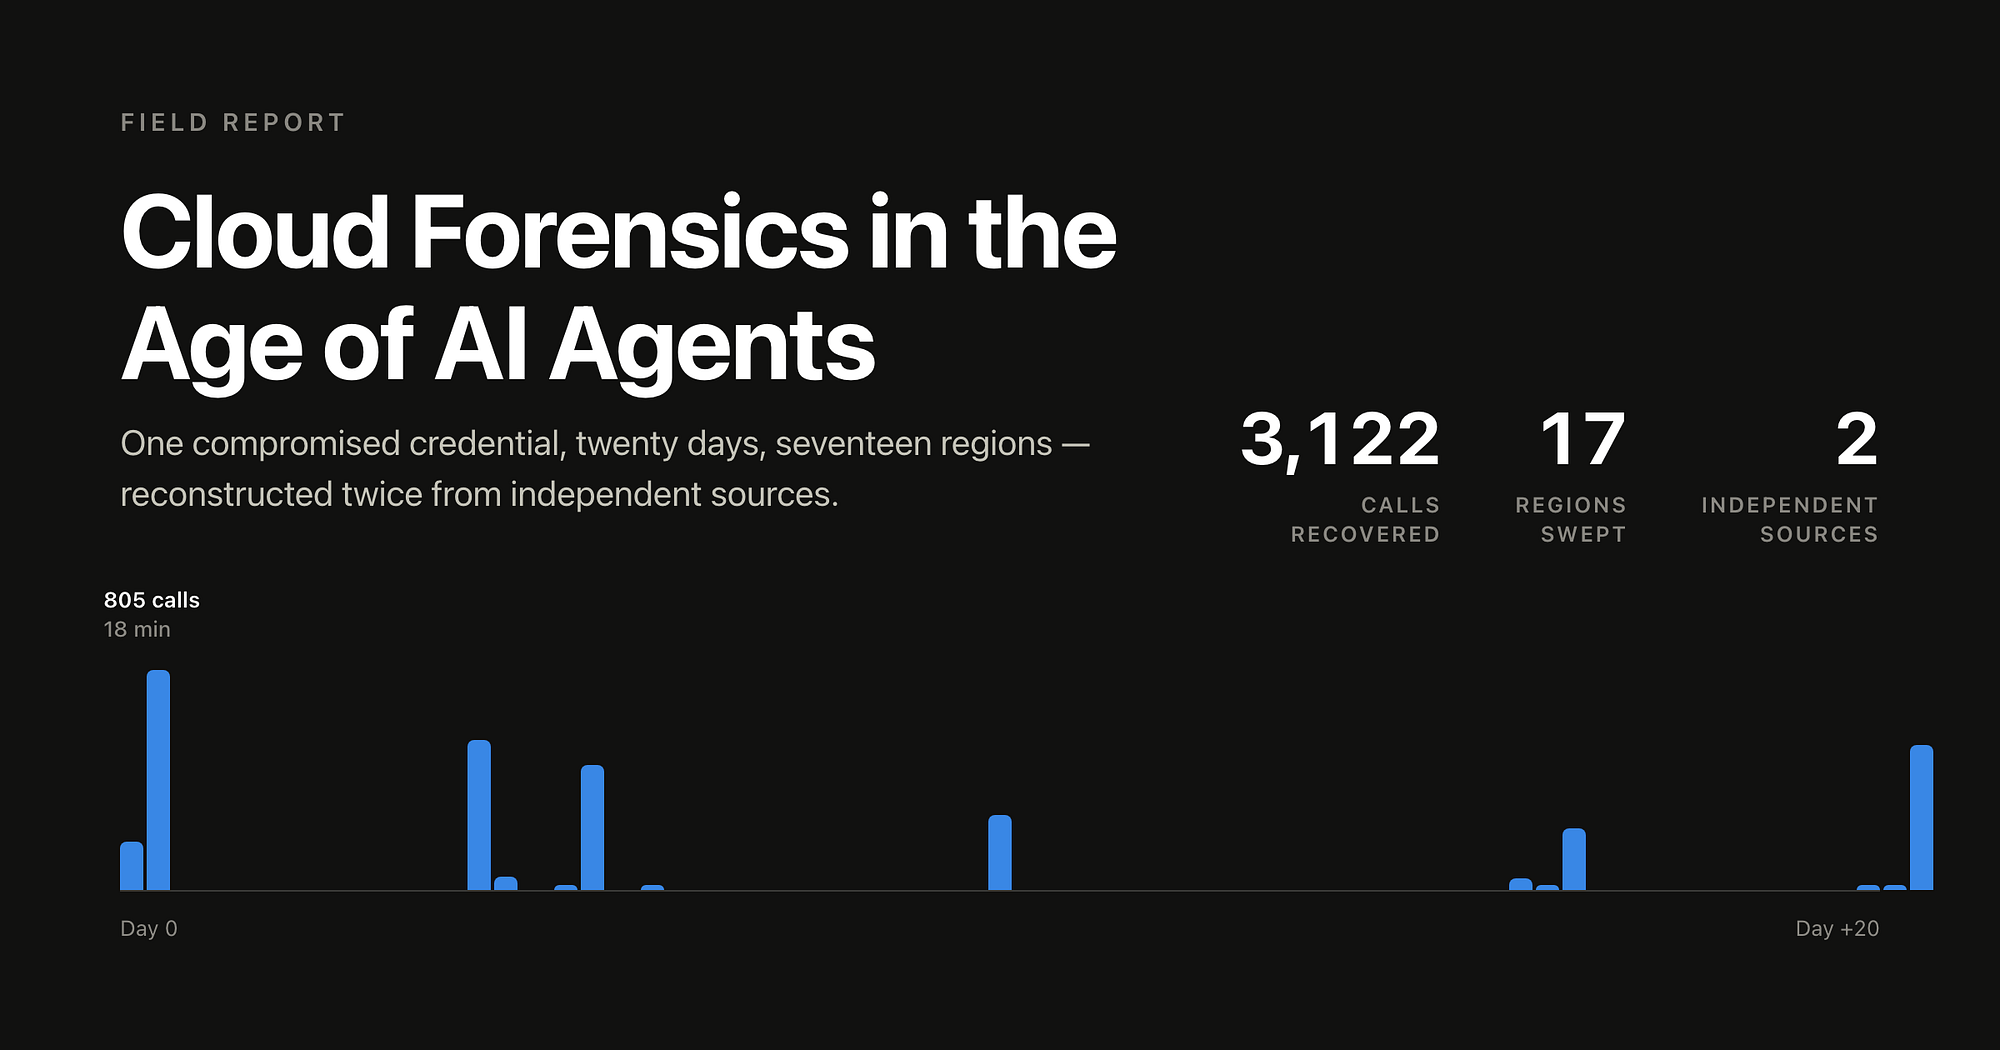
One compromised credential, twenty days, seventeen regions — reconstructed twice from independent sources. What the agent changed, where it was confidently wrong, and what a human still had to do.
⚠️ Disclosure — please read this first
This work was performed under an independent consulting engagement, in a client environment that has no connection to any current or former employer of mine. Nothing here describes, references, or is drawn from any employer’s infrastructure, incidents, or data.
Every client-identifying detail has been removed or replaced: the AWS account, the organization, the support case, the access key and principal, bucket and resource names, the source address (now an RFC 5737 documentation address), and all absolute dates, which appear only as offsets from the credential’s first known use. What remains is method and structure.
Nothing in this post is an indicator of compromise for any real, currently-reachable environment.
If you run anything on AWS, you already know the email. Subject line in brackets, and the brackets are the tell:
[Action Required] Irregular Activity Detected for Your AWS Access Key
As part of our standard monitoring of AWS systems, we observed anomalous activity in your AWS account that indicated your AWS access key(s), along with the corresponding secret key, may have been inappropriately accessed by a third party…
Then the instructions: delete the key — delete, not disable — rotate what it touched, review the account, confirm back. Attached, a short list of the events their monitoring flagged, all from a single day.
Four steps, and one of them is doing an enormous amount of load-bearing work in a single sentence: review your account for unauthorized activity.
Here is what that sentence actually asked for, once we went looking:
- 3,122 API calls recovered across seventeen regions and a twenty-day window — nineteen days longer than the notification suggested;
- the same 3,122 reconstructed a second time, from 35,486 raw log files parsed from scratch, to confirm the first number wasn’t an artifact of the tool that produced it;
- a third source — 17,776 S3 server access logs — covering activity the first two structurally could not record;
- exfiltration assessed without the direct evidence existing, from billing telemetry, with the limits of that inference written down;
- a controlled experiment in a clean account to resolve one ambiguous line in the report;
- and the case-closing response to AWS Support, cut to fit a hard character limit without giving away more than it had to.
That took two and a half hours and fourteen messages from me. A conventional version of the same engagement is four to six days, and it does not include the second and third sources at all — those are the first things a deadline removes.
This is a field report on how that work actually goes: the order it happened in, what the agent did, where it was confidently wrong, and what a human still had to do.
The thesis, stated up front so you can argue with it as you read: the agent didn’t do the investigation. It collapsed the cost of “let me just check that” to near zero, and that changes which hypotheses you’re willing to test. Everything else in this post is evidence for or against that sentence.
Ground rules
Beyond the disclosure above: the structural numbers — call counts, service counts, byte counts, timings — are real and unmodified. They’re the only part of this with any teaching value, and rounding them would make the post useless without making anyone safer.
The cloud is AWS and I’m going to say so, because every service name below already gives it away and pretending otherwise would just make this harder to read. Naming the platform identifies nobody; the specifics that would are the ones I’ve taken out.
The client received a prioritized remediation plan covering the posture findings this work surfaced. Those specifics aren’t in this post and won’t be — what’s here is the method, plus the one or two findings that generalize past the environment that produced them.
I’m also going to be specific about the tooling, because vagueness is how this genre becomes marketing. I worked in a terminal, with an agentic assistant that can run shell commands, read their output, and decide the next command on its own. It had the AWS CLI, read access to the account through SSO, a scratch directory, and no ability to change anything in the environment. Everything below that sounds like magic is a shell loop the agent wrote, ran, and read back.
Hour zero
That attached list of events is where most incidents go wrong. It reads like the scope of the compromise. It is, in fact, a sample — the calls that happened to trip AWS’s own monitoring, on the day it tripped. Treating it as the incident is the first and most common error, and here it was off by nineteen days.
What we actually knew:
- one access key, belonging to an IAM user whose name described its job (something like
s3-manager), carrying broad S3 permissions and nothing else; - one source address, in a European hosting range;
- a handful of flagged events, all from the final day.
What we didn’t know: when it started, what it reached, whether anything was written, whether anything was read, whether other credentials were involved, and whether the audit trail itself was intact.
And the constraints, which are the part worth memorizing, because they’re everyone’s constraints:
- CloudTrail data events were not enabled. No
GetObject, noListObjectsV2, noPutObject— none of it in the trail. The control plane sees who asked about your buckets. It does not see who read them. - Lookup is capped at ninety days, and the log bucket’s lifecycle matched it. The key had existed for years. Anything before that horizon is structurally unknowable, and no amount of cleverness recovers it.
- Seventeen Regions. An enumeration campaign doesn’t respect the two or three Regions you actually deploy to.
- The detective controls that should have caught this were, in aggregate, absent or non-functional. Why, and what that cost in days, is Act IV — but it isn’t knowable yet at this point in the story, and that ordering is the point.
A human working this alone triages by budget. You pick the two Regions you deploy in, pull events for the flagged key, build a timeline, and write it up. It’s not sloppy — it’s arithmetic. Sweeping seventeen Regions with pagination, then independently parsing every raw log file the trail ever delivered as a cross-check, then downloading eighteen thousand access logs on a hunch, is a week of work to answer questions you’re fairly sure are already answered.
That arithmetic is what changed. Not the judgment. The arithmetic.
Act I — Two independent sources, or it didn’t happen
The first thing I asked for was the obvious one: every event associated with that key, all Regions, full retention window, paginated properly.
The result came back at 3,122 events. All from a single source address. All from a single key.
- 84 successes
- 2,539
AccessDenied - 499
Client.UnauthorizedOperation - 0 writes — not one event with
readOnly=false
A 97.3% denial rate, which by itself tells you the shape of the thing: this is not an operator who knows what they have. This is a script finding out.
Now. That number, 3,122, was produced by a machine that I could not fully audit, running a command I skimmed, against an API whose pagination behavior is a well-known source of silent truncation. I have seen lookup-events quietly return the first page and move on. Earlier in the same investigation, a per-user collection did exactly that: capped at fifty results and reported success.
So the second thing I asked for was the same answer by a different road: download every raw log file the trail had delivered to S3 across the window, and parse them from scratch.
That’s 35,486 gzipped files, about 172 MB, 298,196 events — the entire account’s activity, every principal, every Region, not just our key. Written to disk, decompressed, parsed by a small script with no knowledge of the first result.
The two methods agreed exactly:
3,122 events. 84 successes. 2,539 denials. 499 unauthorized operations. Zero writes.
Number for number, from two collection paths that share no code, no API, and no assumptions.
This is the part I want to press on, because it’s the actual methodological shift and it’s the opposite of the one people expect. Agents make it cheap to produce an answer. That makes the answer less trustworthy per unit of effort, not more — you didn’t feel the cost of producing it, so you don’t instinctively weigh it. The correction isn’t to slow down. It’s to spend the surplus on independent confirmation of anything you’ll put your name on.
A second source that shares the first source’s collection path is not a second source. Re-running lookup-events with different flags proves nothing about lookup-events. The raw files were a genuine second source because the only thing they have in common with the API is the service that wrote them.
The full-account parse paid for itself twice more, incidentally. It established that in 298,196 events across the window, the compromised key was the only access key with any activity at all — the other keys on the account had exactly zero. And it established that the account’s entire population of sensitive writes in that period was six events, all from a legitimate automated setup process on a day the attacker wasn’t active. Both of those are negative results, both took minutes, and neither would have been worth a human’s afternoon.
The shape of the campaign
With the inventory settled, the sessionization is trivial: sort by time, cut wherever the gap exceeds thirty minutes. Fourteen sessions across seven active days, from Day 0 to Day +20.
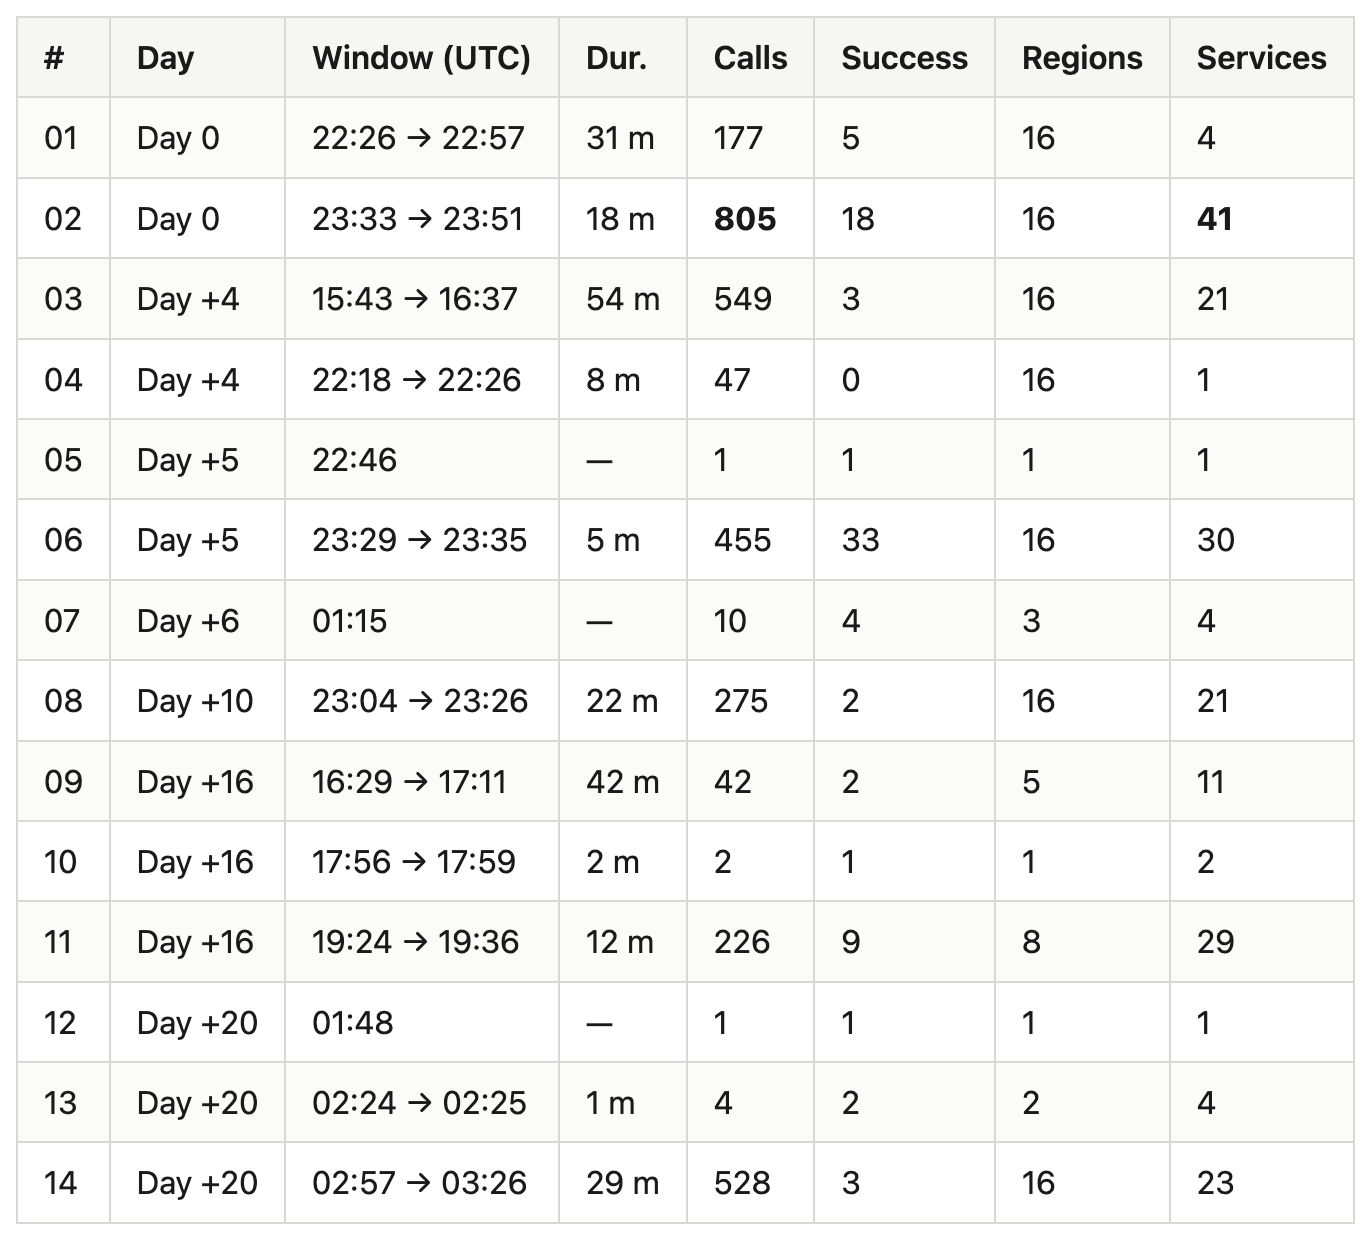
Session 02 is the signature: 805 calls against 41 distinct services across 16 Regions in eighteen minutes. Nobody does that by hand. That’s a permission-brute-forcing tool walking a service catalogue.
Session 12 is my favorite artifact of the whole campaign. One call — sts:GetCallerIdentity — with the literal user agent string aws-cred-validator. Thirty-six minutes before the largest session of the last day. That’s not the attacker’s exploitation tooling; that’s their inventory management. The credential was sitting in a collection, and something checked whether it was still alive before the operator spent time on it. The other sixty-nine user-agent variants were rotating Boto3 strings on Python 3.12 on a generic Linux kernel, which tells you nothing except that they weren’t trying to hide.
And the 84 successes, in full:
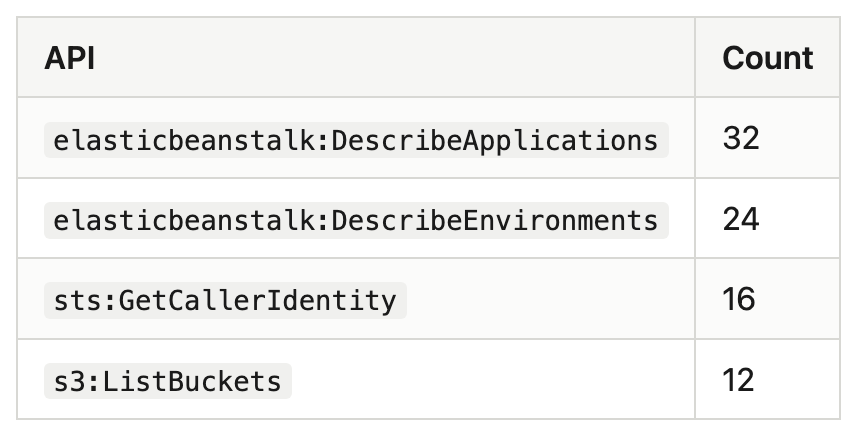
Four read-only APIs. Twenty days of effort against forty-three services in sixteen Regions produced a list of bucket names and confirmation of their own identity. Least privilege at the service boundary held — the grant was broad within S3 and nonexistent outside it, and that boundedness is the entire reason this is a post about detection rather than a post about a breach.
Hold on to those first two rows, though. Fifty-six successful calls to a service the account didn’t use. They come back later, and they’re the most interesting thing in the dataset.
Act II — Proving an absence
Here’s the question the client actually needed answered, and the one no amount of event-counting resolves: did anything leave?
The credential had broad S3 permissions. There were no data events. GetObject is invisible in the trail by construction. The direct evidence doesn’t exist and never did — you cannot go get it, because it was never recorded.
So you reason about ghosts. Reading an object costs money and generates telemetry in the billing system, which is an entirely different subsystem from CloudTrail, with different failure modes and — critically — no attacker-facing surface. Nobody tampers with Cost Explorer.
The agent pulled usage by usage type for a 25-day pre-attack baseline and the 21-day attack window, computed the deviation of each attack-window peak from its baseline mean, and flagged the outliers:
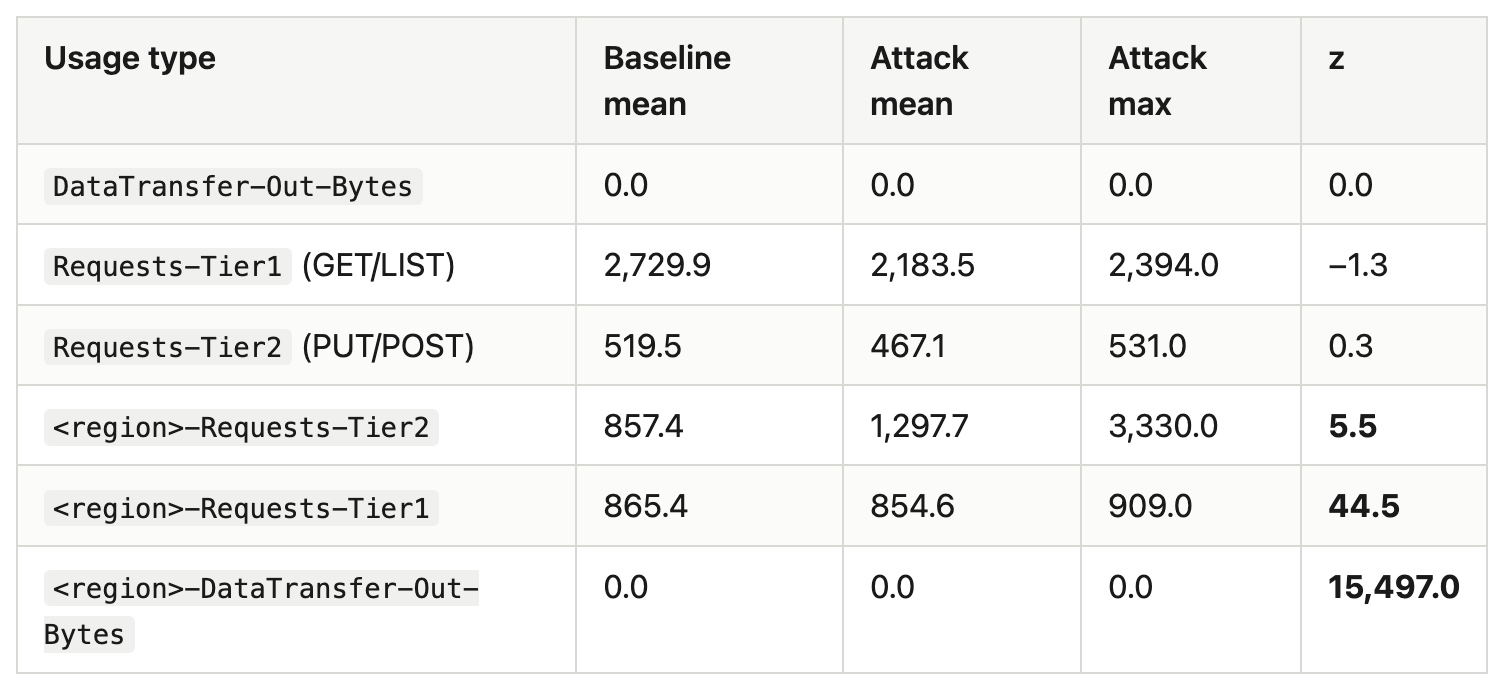
Read rate went down during the attack window. Three rows got flagged, and this is where a fast tool becomes a liability if you let it write your conclusions: a z-score of 15,497 looks like the smoking gun of the century, and it is nothing at all. The baseline standard deviation is effectively zero, so any rounding-level movement produces an astronomical score. Look at the absolute columns instead — zeroes at the precision the API reports. The 44.5 is the same artifact: 854.6 against a baseline of 865.4 is less traffic wearing a scary number.
The one genuine outlier, the 5.5, took real work to dismiss. It traced to organic traffic from a CDN-fronted site in that Region, on days that didn’t intersect the attacker’s sessions at all.
Then the same question from the events themselves, which do carry byte counts even for management-plane calls: additionalEventData.bytesTransferredIn/Out for every S3 event in the window.
bytes out : 71,388     (12 × ListBuckets, byte-identical at 5,949 bytes each)
bytes in  : 0
Twelve identical responses. The same bucket list, fetched twelve times over twenty days, unchanged. Nothing else moved.
And now the sentence that matters more than any of the numbers above, which went into the report in exactly this form:
This method excludes bulk exfiltration. It does not exclude the retrieval of a small number of small objects.
That is the honest boundary of billing-as-proxy. A few hundred kilobytes of credentials pulled out of a config file would hide comfortably inside the noise of an account’s daily variance. I can prove nothing large left. I cannot prove nothing left.
Writing that down is not humility as a personal virtue. It’s the load-bearing structure of the whole report. Every reader who knows the domain is going to ask “but data events were off, so how do you know?” — and a report that has already answered it survives that question, while a report that quietly rounds “no evidence of exfiltration” into “no exfiltration” dies on it, along with everything else it claims.
Speed makes overclaiming easier, because the confident summary arrives at the same moment as the evidence, in the same voice, formatted the same way. The model will write “no exfiltration occurred” as readily as it writes the nuanced version. Deciding which one is true is not a task you can delegate, and it is not a task that gets easier when the evidence arrives faster.
Act III — The third source, and the thing only it could see
Act II reasoned about data access indirectly, because the direct record didn’t exist. There was one exception, and it was worth chasing.
The trail’s own log bucket was the single bucket in the account with S3 server access logging enabled. That’s a data-plane record — GET, PUT, DELETE on objects and buckets, exactly what CloudTrail wasn’t capturing. It covers one bucket out of many, but it’s the one that matters most: it holds the audit trail itself. If the attacker went near the logs, this is the only place it would appear.
So: pull the access logs and search for the attacker’s address. 17,776 files. Not an interesting task — it’s a sync, a decompress, and a grep — but at conventional cost it’s most of a day of babysitting for a hunch about a single bucket. That’s the calculation that changed. It ran in the background while other work continued.
It returned four hits, all on the last active day:
[Day +20 02:27:22]  203.0.113.42  -                 REST.GET.BUCKET   301  PermanentRedirect   490 B
[Day +20 02:27:23]  203.0.113.42  user/s3-manager   REST.GET.BUCKET   200  -                18,693 B
[Day +20 03:01:26]  203.0.113.42  -                 REST.GET.BUCKET   301  PermanentRedirect   490 B
[Day +20 03:01:30]  203.0.113.42  user/s3-manager   REST.GET.BUCKET   200  -                18,693 B
The attacker ran ListObjectsV2 against the bucket holding the audit trail. Twice. Successfully. Two hundred OK, 18,693 bytes each. The 301s are the same request hitting the wrong regional endpoint one second earlier and being redirected — the tooling didn’t know which Region the bucket lived in, which is itself a small tell about how blind they were.
Correlate against the control-plane timeline and the sequence is unambiguous: s3:ListBuckets succeeds, and roughly two minutes later ListObjectsV2 fires at one of the names it returned. Twice, on the same day, thirty-four minutes apart. That’s a human or a script reading a bucket list and going after the interesting-looking name.
None of it is in CloudTrail. Not one of those four requests. If the access log on that single bucket hadn’t happened to be enabled, this would not exist in any record anywhere, and my report would have said the attacker’s activity was confined to the control plane — confidently, in writing, to a client, and to AWS.
The full picture across all 17,776 files, and it is precise in both directions:
- four requests, all
REST.GET.BUCKET, two redirected, two successful; - zero
REST.GET.OBJECT— not a single object retrieved; - zero writes or deletes, on a bucket where this credential had permission to erase everything;
- no pagination —
max-keys=40, twice, no continuation token. They listed the first page and stopped.
So the audit trail was enumerated, not read and not altered. That is a genuinely reassuring finding, and — this is the point of the act — it is a finding, not an assumption. Two days earlier the same conclusion would have been an inference from the absence of contrary evidence in a log source that never recorded the relevant events.
This is also the third independent source in the investigation, and the only one of the three that could see the data plane at all. That’s what makes it worth the day of grinding it would conventionally have cost: not that it was likely to find something, but that it was the only instrument pointed at the question.
A note on how this nearly went wrong. While the download was still running, the agent grepped what had landed and reported zero occurrences — and I put that in a draft. It wasn’t lying; the grep had simply covered the first two days of a twenty-day window, and the answer arrived in exactly the tone and format it would have used over the complete set. Coverage isn’t something the tool tracks for you. The rule I took away, and now apply without exception: a negative finding is invalid unless the coverage it rests on is stated in the same sentence. Not “the IP does not appear in the access logs,” but “the IP does not appear in 17,776 of 17,776 files covering Day 0 through Day +20.” The second can’t fail that way, because writing it forces you to go count.
Act IV — Asking why nothing fired
With the timeline settled, a question became answerable that hadn’t been before: the attacker made 2,539 denied calls across twenty days. Why did no control anywhere say anything?
Note the shape of that question. It isn’t “is the alarm configured” — a checkbox anyone can tick in a console. It’s “given this exact sequence of events, at these exact times, what should have fired, and what did?” You can only ask it once you have the event inventory, which is why it comes fourth in this post rather than first. The reconstruction is what turned a posture question into a testable one.
The answer had two layers, and the second is the one nobody talks about.
(a) Alarms that die silently
The account had twelve CIS-benchmark alarms, including one for authorization failures with a threshold of one — a single denied call anywhere and it fires — wired to two notification topics, one of them named after this precise scenario. It had been reporting OK for seven months.
Not because nothing was failing. Because nothing was arriving. Here’s the chain, and where it was cut:
API call
     │
     ▼
  CloudTrail  ──────────────► S3 bucket        ✅ delivered, 100% intact
     │
     ▼
  CloudWatch Logs group      ❌ does not exist
                                (LatestCloudWatchLogsDeliveryError: ResourceNotFound;
                                 last successful delivery ~7 months earlier)
     │
     ▼
  Metric filter              ❌ zero metric filters, any Region
     │
     ▼
  Metric                     ❌ 0 datapoints / 60 days
     │
     ▼
  Alarm (Threshold = 1)      🟢 OK  ← reports healthy, forever
     │
     ▼
  SNS → humans               (never reached)
The trail itself was fine — delivery to S3 never missed, which is exactly why the raw-file cross-check in Act I worked at all. What broke was the branch to CloudWatch Logs, months before the incident, silently.
The failure mode is the dangerous one. Not an alarm that fired and got ignored — an alarm that is green because it is receiving nothing. TreatMissingData = notBreaching is the accelerant: correct for a capacity alarm (no traffic, no problem), inverted for a security alarm, where “no evidence of attacks” and “no data at all” collapse into the same state, and it’s the good one. Twelve alarms hung off that chain and all twelve were green.
Had it been intact, the authorization-failure alarm fires on Day 0 at 22:57 UTC, on the first denial of 2,539 — nineteen days and three hours before AWS’s notification, and before five of the seven active attack days.
The generalizable part is one paragraph: if you deployed a CIS baseline from a module and never tested it end to end, publish a synthetic event and watch it traverse trail → log group → metric filter → metric → alarm to a human’s inbox. Five links, any of which a Terraform refactor or an unrelated cleanup can sever without a word. I’d guess a meaningful number of green dashboards have a cut somewhere in there right now.
The client got the full finding and a prioritized remediation plan. What’s interesting here isn’t the misconfiguration — those are everywhere — it’s that pinning down “would have fired on Day 0 at 22:57” required the event-level reconstruction from Act I. Without it, this is a generic audit note. With it, it’s a measured nineteen-day gap.
(b) APIs that deny without producing a signal
Now those fifty-six Elastic Beanstalk calls.
DescribeApplications and DescribeEnvironments returned 200 OK to a principal with no Elastic Beanstalk permissions whatsoever. No AccessDenied. No error code in CloudTrail at all — the field is simply None, exactly as it is for a legitimately authorized call.
Sit with the detection consequence for a second, because it generalizes far past one service.
Essentially every reconnaissance detection in cloud security is built on counting authorization failures. The CIS alarm counts them. Managed threat-detection findings for credential misuse lean on them. Every SIEM rule anyone has ever written for “principal is enumerating” is a COUNT(errorCode = AccessDenied) GROUP BY principal with a threshold on it.
An API that denies you by returning 200 and an empty list produces no such signal. Not a weak signal — none.
In this incident that’s measurable. The 3,038 denials would have tripped the threshold-of-one alarm instantly, if the alarm had been alive. The fifty-six Elastic Beanstalk calls would have produced nothing, even with every control functioning perfectly. An attacker who confined themselves to APIs that fail this way would walk through a fully-instrumented account leaving a trail indistinguishable from an authorized service.
I don’t think this is a defect — I’ll get to why in a moment, and the answer surprised me. But it’s a real blind spot in how the industry builds recon detection, and it’s the kind of thing you only notice when you’re staring at fifty-six unexplained rows at three in the morning wondering why they don’t have an error code.
Which brings me to the experiment I shouldn’t have run.
Act V — The proof of concept that killed its own finding
At this point the draft report contained a sentence I’d written with more confidence than the evidence supported:
“The API does not perform an effective authorization check.”
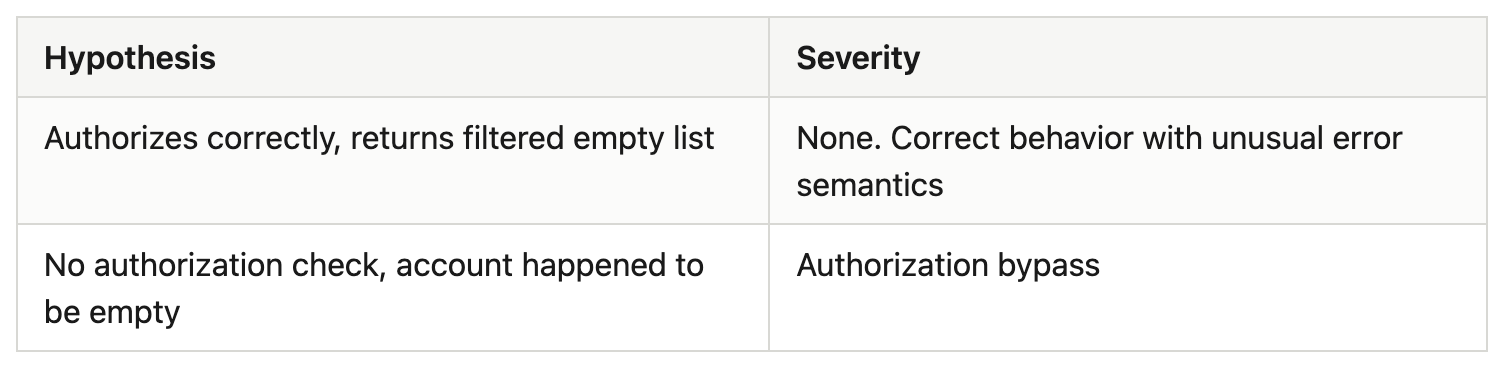
That was an inference from an absence — no errorCode, therefore no check — dressed up as a finding. And there was a second hypothesis that fit the same data exactly as well: the API does authorize, and returns a permission-filtered empty list. Both produce 200 OK and an empty array. Both look identical in CloudTrail.
I couldn’t tell them apart, for a reason that’s almost funny: the account had no Elastic Beanstalk applications at all. Empty-because-you-lack-permission and empty-because-there’s-nothing-there are the same response. The one thing I needed to distinguish the hypotheses was the one thing the environment couldn’t give me.
The severities are not close:
You cannot ship that ambiguity in a report. So we built the test — in a separate account, on infrastructure with no relationship to the client’s.
Setup: one Elastic Beanstalk Application — a logical metadata object, no environment, therefore no compute provisioned and no cost. One IAM role with a single inline policy granting exactly one permission: s3:ListAllMyBuckets. No managed policies. No elasticbeanstalk:* of any kind.
Controls, because a test without controls is an anecdote: the same role calling two other services it also lacked permission for.
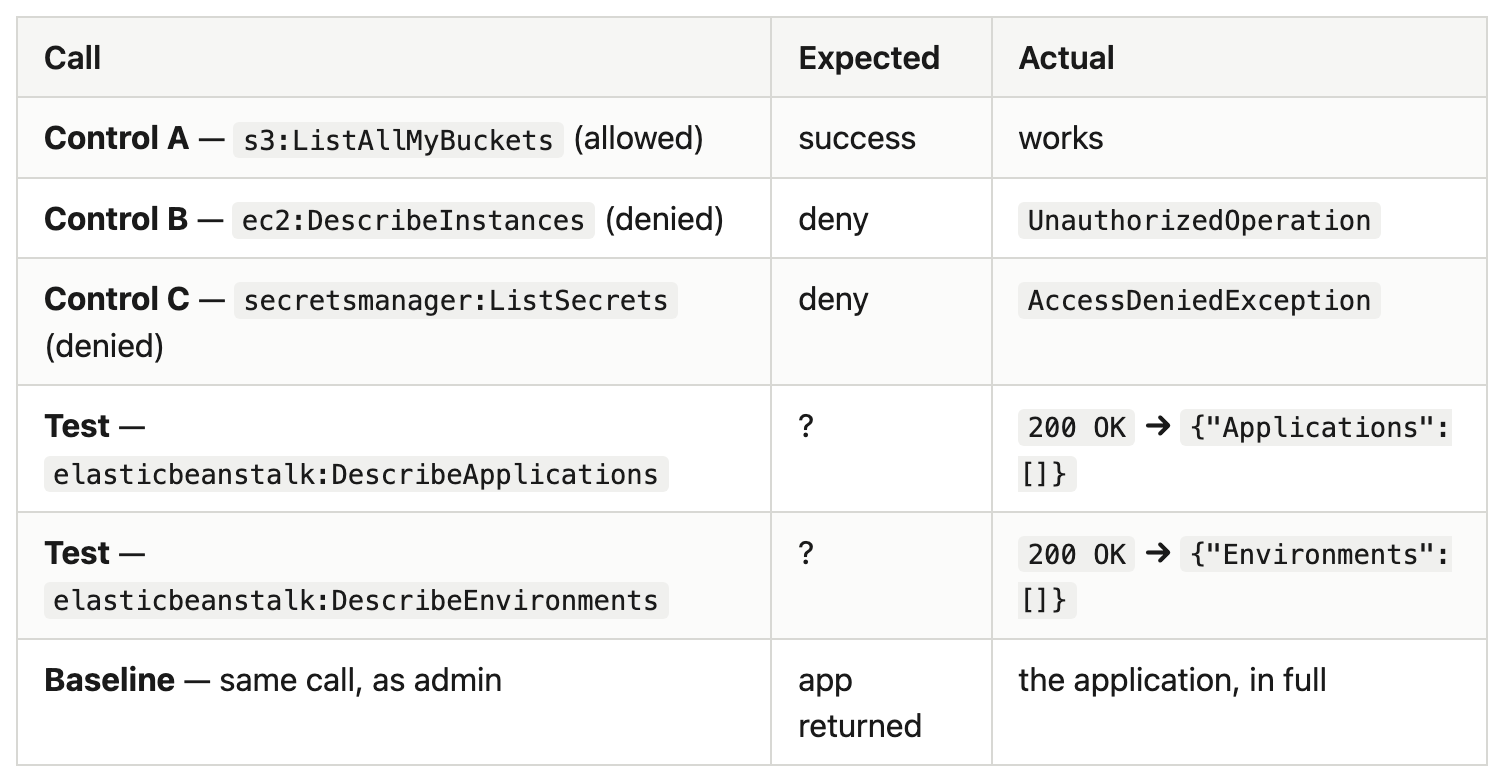
The controls confirm the role genuinely has nothing: two other services denied it explicitly, with two different error shapes. And the decisive comparison is the last two rows against the baseline — the application existed. It was returned to the admin caller and withheld from the unprivileged one.
So: authorization is enforced. Only the failure signal differs. Hypothesis two. No bypass.
Total elapsed time from “we need to test this” to a controlled experiment with three controls and a clean result: about eight minutes. That number is the whole argument for working this way. This test was always possible — it’s four CLI calls and an IAM policy. It just never cleared the bar of “worth an afternoon to close a footnote in a report.”
The question I hadn’t thought of
I presented that result. The response I got back was one sentence, and it broke my test:
“And if no applications existed — would it still return 200 and empty? If not, that’s a way to detect whether applications exist without permission.”
That’s an existence oracle, and it would be a real disclosure class, mild but real. If the unprivileged response differed depending on whether resources exist, an unauthorized caller could infer “this account runs Elastic Beanstalk” — reconnaissance with no permission at all.
My test had covered one cell of a two-by-two. I’d tested application exists × no permission and application exists × permission, and concluded. The empty-account row was missing, which is remarkable given that the empty-account row is the exact condition that created the ambiguity in the first place.
Fortunately the test infrastructure was still up, so closing the matrix took minutes: one Region holding the application, two Regions holding nothing.
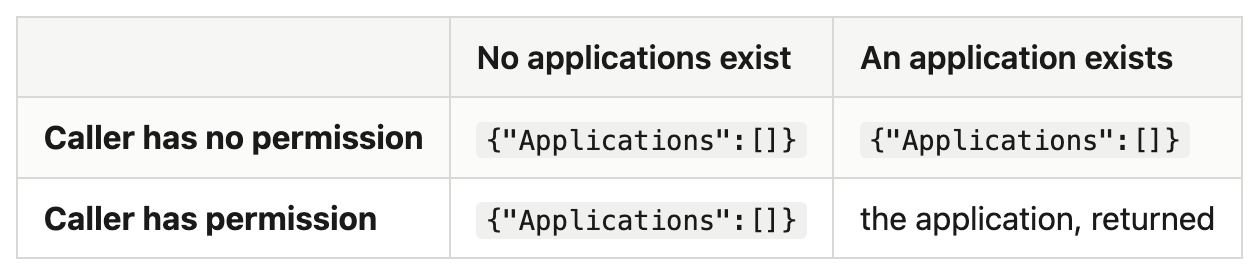
The two top cells are byte-identical, across three Regions, same status code, same body, no error of any kind.
The sharpest way to put it: an unauthorized caller sees exactly what an authorized caller would see against an empty account. There is no side channel — not in the body, not in the status code, not in the error type, not in latency in any way I could measure. It fails closed and it fails indistinguishably. That’s correct security behavior, arguably more correct than an explicit denial, which at least confirms the service is in use.
I also confirmed how those calls land in the trail, which closes the loop with the incident:
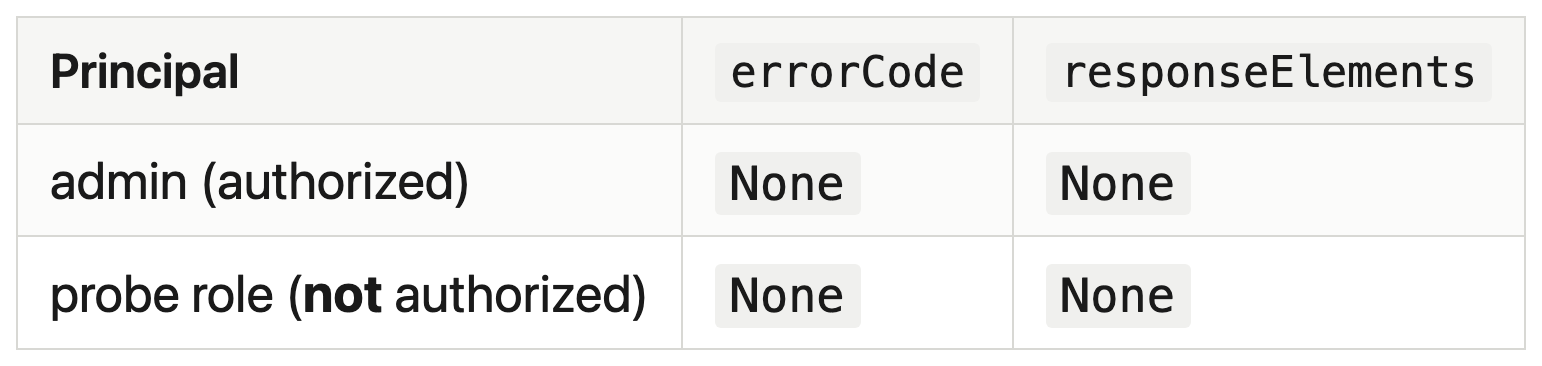
Identical. That’s the incident’s signature, reproduced on demand in a controlled account.
And then I read the documentation
The behavior is documented. By the vendor. On the API reference page for the exact call, in plain language:
“This action only returns information about applications that the calling principle has IAM permissions to access. […] If the user doesn’t have access to any of the applications an empty result is returned.”
Not a bug. Not a discovery. Published contract, sitting on the reference page, where it had been the entire time. My experiment had faithfully reproduced the documentation.
That’s the method error, and it’s the one I’d most want you to take from this post. I should have read the reference page before designing the experiment. It cost me maybe an hour, and it produced a moment of real clarity about what changes when the cost of doing collapses:
When running the experiment gets cheap enough, running it becomes easier than looking it up. The cheaper it is to test, the more expensive it becomes to skip the documentation.
The old economics enforced discipline. Building a test rig was expensive, so you read first, and reading first is correct — the answer might already exist. When the rig costs eight minutes, that guardrail is gone, and you have to reinstate it deliberately.
The test wasn’t wasted, to be fair. It closed an open anomaly in the report with first-party evidence rather than a citation, it established that no oracle exists — which the documentation doesn’t state and which was a legitimate open question — and it produced the detection argument in the previous section, which I think is the genuinely useful idea in this whole investigation. But the primary question had a published answer and I spent effort rediscovering it.
Disclosure decision: nothing to report. No authorization bypass, no cross-boundary disclosure, nothing a vendor security team would open a case on. Reporting documented behavior as a vulnerability costs you exactly the credibility you’d want on the day you find something real. That decision took me thirty seconds and no tool was involved in it, which is the point of the next section.
Act VI — The last mile, which nobody writes about
Half of incident response is writing. Not the technical report — the communication. And it’s the half where I’ve seen the most damage done, because the instinct that serves you well internally is precisely wrong externally.
AWS Support wanted the response in their console: confirm the steps, describe the review, request closure. Fixed field, hard character limit.
The technical post-mortem ran to tens of thousands of characters. The limit was 8,000. So it went:
14,685 → 7,955 → 6,616 characters.
The first cut was mechanical: enumerated lists of denied APIs became counts, billing tables became one line with the numbers in it, the remediation plan went from three blocks to two paragraphs. Nothing load-bearing was lost. An agent is genuinely excellent at this — it’s rewriting under a constraint with a checkable objective, which is close to the ideal task shape.
The second cut wasn’t mechanical, and it wasn’t the model’s idea. It came from asking a different question:
“What am I handing them that nobody asked for?”
Eight items came out. Not one of them was false, and not one of them was requested:
- a summary of the client’s data footprint — storage volume, object counts. Nobody asked. It’s an inventory of what’s worth stealing.
- “twelve alarms non-functional for seven months” — a written admission of an unremediated control failure, handed unprompted to an external party, in a record that persists.
- the status of every detective control in the account. A map of where nobody is looking.
- misconfigurations found during the review that were still open.
- a phrase conceding possible exposure of secrets, hedged, unnecessary, and quotable out of context.
- a note on how long a credential had gone unrotated. Self-incriminating, adds nothing to their assessment.
- a commercial relationship with a third party, irrelevant to the recipient.
- an invitation for them to comment on our findings, which is an invitation to a discussion nobody needed.
The principle I settled on is three distinct commitments, and most teams collapse the last two:
- Don’t lie. Non-negotiable, including by omission of anything that changes their assessment.
- Don’t withhold what they need to evaluate the situation. They’re assessing whether an account is a threat. Everything bearing on that goes in, in full.
- Don’t volunteer your internal posture. Your control gaps, your inventory, your unremediated findings, your organizational weaknesses. They didn’t ask, they don’t need it to close the case, and it will exist in a record you don’t control, forever.
Two and three feel like the same value when you’re being cooperative at four in the morning. They’re not. The rewrite kept every number that proved the review had been done — 3,122 calls, 84 successes, zero writes, sixteen Regions, forty-three services, the confirmed data-plane listing, the honest statement of residual uncertainty — and dropped every sentence that described the client rather than the incident.
Then a detail that’s pure agent-collaboration hazard and I’d never have predicted it.
I prepared an evidence package: seven files, event inventory, timeline, service matrix, the access-log lines. On a final read-through: four of the seven had Portuguese section headers. The analysis scripts had been written during a conversation conducted in Portuguese, so the agent had generated the report headers in Portuguese — perfectly reasonably, and nobody had said otherwise. Artifacts inherit the language of the conversation that produced them, silently, and the mismatch only surfaces at the moment you’re about to hand them to someone.
If you work with an agent in one language and deliver in another, that’s a checklist item. It costs nothing to check and it’s embarrassing to miss.
The package didn’t go, in the end — the response stood on its own, and the smaller thing you hand an external party, the smaller the surface for follow-up questions. The remaining artifacts stayed with the client, where they belong.
What actually changed, and what didn’t
Didn’t change — every decision:
- Judgment about what the numbers mean. The z-score of 15,497 was nothing; that call was mine.
- Scope. What to investigate, what to leave, when the evidence was sufficient.
- The disclosure decision. That was thirty seconds of professional judgment about credibility, and no tool contributed to it.
- Calibration of what to say to an external party. The eight removals came from asking a question the model wasn’t going to ask itself.
- The question that broke my own test. “And if no applications existed?” was a human noticing a missing quadrant.
Changed — the number of hypotheses that got tested rather than estimated:
Every one of these would have been “not worth the time” in a conventional engagement with a deadline:
- parsing 298,196 raw events from scratch purely to cross-check a number I already had;
- downloading 17,776 access log files on a hunch about a single bucket;
- computing a per-usage-type statistical baseline across two windows to reason about exfiltration;
- building a controlled authorization test in a clean account to resolve one footnote;
- extending that test across three Regions to close a two-by-two.
Two of those five materially changed the report. The raw-file parse validated the central numbers, without which the whole document is one tool’s opinion. The access-log download produced the only direct evidence anyone will ever have about what the attacker did on the data plane — and turned the most sensitive conclusion in the report from an inference into a finding.
I want to be careful about the causal claim here. The agent didn’t discover anything. It ran a grep I asked for, on data I asked it to fetch. What it did was make the fetch cheap enough that I asked for it at all, on a hunch about one bucket, while other work carried on.
That’s the actual shift, and it’s smaller and more interesting than “AI does forensics”:
The threshold for “let me just check that” dropped to near zero. So marginal hypotheses — the ones you’d previously drop for budget — get tested. And every so often, one of them is load-bearing.
The work shifted from executing to directing and verifying. And verification is now the scarce skill. The agent produced a number I couldn’t audit by reading; I could only audit it by producing it a second way. Someone who doesn’t know which number to double-check, or what a second independent source even means in this context, gets all of the speed and none of the safety. The tool amplifies whatever methodology you already had — including the absence of one.
What I’d have you check tomorrow
Method — if you work this way:
- State coverage inside every negative finding. “X does not appear” is not a finding. “X does not appear in N of N files covering the full window” is. The first sat unsupported in my draft for forty minutes and looked identical to the second.
- Confirm any agent-produced number through a path that shares no code with the first one. Same tool with different flags is not a second source.
- Read the API documentation before you build the test rig. Especially now that building the rig is the cheaper of the two.
- Write down what you did not prove, in the same document as what you did. It’s the only reason the rest of the document survives a competent reader.
- Decide what you’re volunteering before you send it. Don’t lie, don’t omit what the recipient needs, don’t hand over your internal posture. The last two feel like the same value at 4 a.m. and aren’t.
Environment — what this particular investigation surfaced:
- Test every security alarm end to end. Publish a synthetic event and follow it: trail → log group → metric filter → metric → alarm → a human’s inbox. A green dashboard proves nothing about a chain you’ve never exercised. While you’re there, check
TreatMissingData:notBreachingon a security alarm means “silence is health,” and silence is exactly what a broken pipeline produces. - Enable S3 data events on your trail’s own log bucket at minimum. The only reason I know what the attacker did on the data plane is that one bucket happened to have access logging on. That was luck. Don’t run on luck.
- Alert on shape, not on events. No single call in this campaign was remarkable. The shape was: one principal, forty-three services, sixteen Regions, a 97% denial rate, inside twenty minutes. Distinct-service and distinct-Region counts per principal per hour would have fired on Day 0. So would a denial count. None of these need a threat feed.
One last thing, about honesty
There’s a fifth artifact I haven’t mentioned. I started a cryptographic validation of the trail’s digest files — the mechanism that proves log files weren’t altered after delivery. It ran for the better part of an hour across twenty-three days and seventeen Regions, and I aborted it before it finished.
So the report does not say the audit trail’s integrity was cryptographically verified. It says the validation was started and not completed, and then it says what two independent sources do support: zero write events of any kind from that credential in CloudTrail — no StopLogging, no DeleteTrail, no UpdateTrail, no PutEventSelectors, with DescribeTrails attempted in sixteen Regions and denied in all sixteen — and, in the log bucket’s own access logs, four requests from that address, all reads, no PUT, no DELETE, no POST, on a bucket where the credential had permission to erase everything.
We didn’t prove the digests. We proved nobody executed an operation capable of altering the record. Those are different sentences and the report uses the second one.
It would have been very easy to let the first one stand. Nobody was going to check. The agent would have written either sentence just as fluently, in the same confident register, formatted the same way — and that, in the end, is the thing to internalize about working like this. These tools do not produce false confidence; they produce fluent confidence, and fluency is what we’ve all been trained to read as rigor.
The difference between a report that survives scrutiny and one that doesn’t now lives almost entirely in a human’s willingness to write the less impressive sentence.
Details of the environment, the organization and the timeline have been changed or removed. The structural findings, counts and behaviors are unmodified.